Thank you for visiting SNEWPapers!
Sign up free
Constitutional Whig
Richmond, Virginia
What is this article about?
Statistical analysis of Virginia's 1790-1830 population growth by race (whites, free people of color, slaves) and region (east/west of Blue Ridge), showing similar increase rates for white (57.08%) and black (57.93%) populations, countering alarm over slave growth. Includes P.S. on congressional representation. Richmond, Feb. 28, 1832.
Clipping
OCR Quality
Full Text
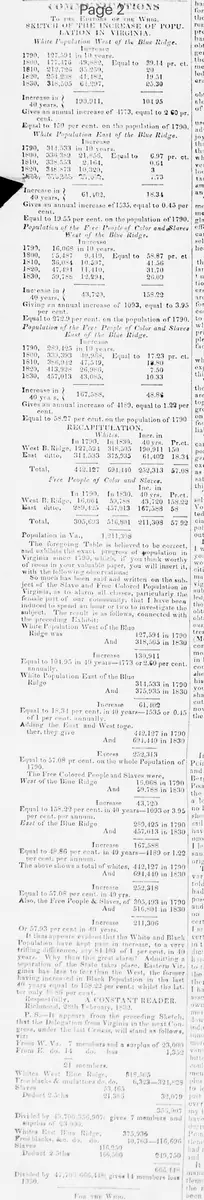
SKETCH OF THE INCREASE OF POPULATION IN VIRGINIA.
White Population West of the Blue Ridge.
Increase
1790, 127,591 in 10 years.
1800, 177,176 19,582, Equal to 39.14 pr. ct.
1810, 212,726 35,250, 20
1820, 254,208 41,182, 19.51
1830, 318,505 61,297, 25.30
Increase in 40 years, 190,911, 101.95
Gives an annual increase of 4773, equal to 2.50 pr. cent.
Equal to 150 per cent. on the population of 1790.
White Population East of the Blue Ridge.
Increase
1790, 311,533 in 10 years.
1800, 336,389 21,856. Equal to 6.97 pr. ct.
1810, 335,553 2,164, 0.64
1820, 318,873 10,320, 3
1830, 375,955 57,082, 7.73
Increase in 40 years, 61,402, 18.34
Gives an annual increase of 1535, equal to 0.45 per cent.
Equal to 19.55 per cent. on the population of 1790.
Population of the Free People of Color and Slaves West of the Blue Ridge.
Increase
1790, 16,068 in 10 years.
1800, 15,487 9,119, Equal to 58.87 pr. ct
1810, 36,094 10,597, 41.56
1820, 47,494 11,110. 31.70
1830, 59,788 12,294, 26.09
Increase in 40 years, 43,720, 158.22
Giving an annual increase of 1093, equal to 3.95 per cent.
Equal to 372.9 per cent. on the population of 1790.
Population of the Free People of Color and Slaves East of the Blue Ridge.
Increase
1790, 289,125 in 10 years.
1800, 339,393 19,968. Equal to 17.33 pr. ct.
1810, 346,912 17,519. 19.80
1820, 413,928 26,956. 7.50
1830, 457,013 43,085, 10.33
Increase in 40 years, 167,888, 43.86
Gives an annual increase of 4197, equal to 1.23 per cent.
Equal to 53.07 pr. cent. on the population of 1790.
RECAPITULATION.
Whites.
Incr. in
In 1790, In 1830, 40 yrs.
West B. Ridge, 127,591 318,505 190,911 150
East ditto, 311,533 375,935 64,402 19.55
Total, 439,124 694,440 255,313 57.09
Free People of Color and Slaves.
Incr. in
In 1790, In 1830, 40 yrs. Pr.ct.
West B. Ridge, 16,068 59,788 43,720 138.23
East ditto, 289,125 457,013 167,888 53
Total, 305,193 516,801 211,608 57.92
Population in Va., 1,211,303
The foregoing Table is believed to be correct, and exhibits the exact progress of population in Virginia since 1790, which, if you think worthy of room in your valuable paper, you will insert it, with the following observations:
So much has been said and written on the subject of the Slave and Free Colored Population in Virginia, as to alarm all classes, particularly the female part of our community, that I have been induced to spend an hour or two to investigate the subject. The result is as follows, connected with the preceding Exhibit:
White Population West of the Blue Ridge was 127,591 in 1790 And 318,505 in 1830 Increase 190,914 Equal to 101.95 in 40 years- 4773 or 2.50 per cent. annually.
White Population East of the Blue Ridge 311,533 in 1790 And 375,935 in 1830 Increase 64,402 Equal to 13.31 per cent. in 40 years-1535 or 0.45 of 1 per cent, annually.
Adding the East and West together, they give 439,124 in 1790 And 694,440 in 1830 Excess 255,316 Equal to 57.08 pr cent. on the whole Population of 1790.
The Free Colored People and Slaves were, West of the Blue Ridge 16,068 in 1790 And 59,788 in 1830 Increase 43,720 Equal to 158.23 per cent, in 40 years-1093 or 3.95 per cent, per annum.
East of the Blue Ridge 289,125 in 1790 And 457,013 in 1830 Increase 167,888 Equal to 49.86 per cent. in 40 years-4197 or 1.03 per cent, per annum.
This above shows a total of whites, 439,124 in 1790 And 694,440 in 1830 Increase 255,316 Equal to 57.08 per cent, in 40 yrs.
Also, the Free People & Slaves, of 305,193 in 1790 And 516,801 in 1830 Increase 211,608 Or 57.93 per cent in 40 years.
It thus appears evident that the White and Black Population have kept pace in increase, to a very trifling difference, only 0.15 of 1 per cent. in 40 years. Why then the great alarm? Admitting a separation of the State takes place. Eastern Virginia has less to fear than the West, the former having increased in Black Population in the last 40 years equal to 58.22 per cent.; whilst the latter only 58.86 per cent.
Respectfully,
A CONSTANT READER.
Richmond, 28th February, 1832.
P. S.-It appears from the preceding Sketch, that the Delegation from Virginia in the next Congress, under the last Census, will stand as follows, viz:
From West Va. 7 members and a surplus of 23,000
From East do. 11 dv. loss 1,352
21 members,
Whites West Blue Ridge, 318,505
Free blacks & mulattoes do. do. 6,283-324,788
Slaves 53,165
Deduct 3/5ths 21,365 32,800 292,988? Wait, calculations garbled but part of P.S.
What sub-type of article is it?
What themes does it cover?
What keywords are associated?
What entities or persons were involved?
Letter to Editor Details
Author
A Constant Reader
Recipient
To The Editors Of The Whig.
Main Argument
the white and black populations in virginia have increased at nearly identical rates over 40 years (57.08% vs. 57.93%), showing no disproportionate growth in slaves and free people of color to justify alarm; even in case of state separation, eastern virginia faces less relative increase in black population than the west.
Notable Details