Thank you for visiting SNEWPapers!
Sign up free
The Independent
Elizabeth City, Pasquotank County, North Carolina
What is this article about?
Article analyzes low Superior Court conviction rates in North Carolina counties like Washington and Currituck, questioning court efficiency and lax enforcement compared to others like Tyrrell and Perquimans. Includes statistics on convictions per 1,000 inhabitants and payment rates, noting limitations of the data from UNC study.
Clipping
OCR Quality
Full Text
WORKING WELL?
Fewer Convictions In Washington
and Currituck
Few
Pay in Dare and Camden
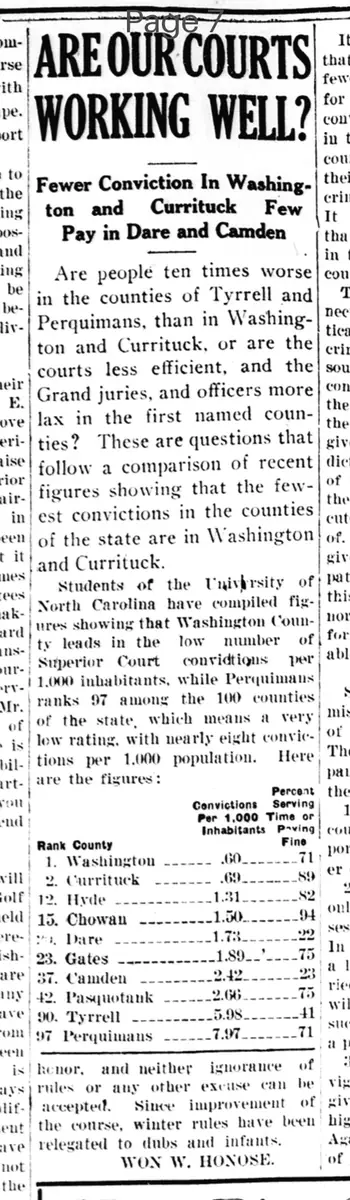
Are people ten times worse
in the counties of Tyrrell and
Perquimans, than in Washington
and Currituck, or are the
courts less efficient, and the
Grand juries, and officers more
lax in the first named counties?
These are questions that
follow a comparison of recent
figures showing that the few-
est convictions in the counties
of the state are in Washington
and Currituck.
Students of the University of
North Carolina have compiled fig-
ures showing that Washington County leads in the low number of
Superior Court convictions per
1,000 inhabitants, while Perquimans
ranks 97 among the 100 counties
of the state, which means a very
low rating, with nearly eight convic-
tions per 1,000 population. Here
are the figures:
Percent
Convictions Serving
Per 1,000 Time or
Inhabitants Paying
Fine or
Honor.
fewer people ever pay the penalty
that especially in Dare and Camden,
It seems from the foregoing table
for the crimes for which they are
convicted. Tyrrell is a close third
in this respect, while in most other
counties, 70 per cent and over pay
their fines or serve time for the
crimes for which they are convicted.
It is interesting to note however
that the most wholesome showing
in the state is in our Tidewater
counties.
The figures were prepared in con-
nection with a comprehensive statis-
tical survey of court records of
crime in North Carolina. The main
source of information in this study
consists of the reports turned in by
the clerks of the superior court of
the several counties. These reports
give the name of every person in-
dicted and prosecuted during a term
of the superior court together with
the offense for which he was prose-
cuted and how his case was disposed
of. The clerk is also expected to
give the age, race, sex, and occu-
pation of each defendant, although
this is not strictly complied with
nor enforced. Therefore such in-
formation is incomplete and unreli-
able.
Limitations
Statistics of crime are notoriously
misleading, especially in the hands
of one not used to their pitfalls.
Therefore, in studying the accom-
panying table please bear in mind
the following limitations:
1. The figures represent superior
court convictions only. The pro-
portion of offenses tried in the low-
er courts varies greatly by counties.
2. The figures are for one year
only. Cases continued to a later
session of court are not included.
In the same way in some counties
a large share of cases may be car-
ried from one year to the next. Data
will be more reliable only when
such a table covers convictions over
a period of years.
3. A sudden shift from lax to
vigorous enforcement of law in a
given year makes the crime rate
high for that year and vice versa.
Again records should cover a period
of years in order to be strictly com-
What sub-type of article is it?
What themes does it cover?
What keywords are associated?
Where did it happen?
Story Details
Location
North Carolina Counties (Washington, Currituck, Dare, Camden, Tyrrell, Perquimans, Tidewater)
Event Date
Recent Figures, One Year Only
Story Details
Comparison of Superior Court conviction rates reveals lowest in Washington and Currituck counties, raising questions about court efficiency and lax enforcement versus higher rates in Tyrrell and Perquimans; low payment rates in Dare and Camden; data from UNC study with noted limitations.