Thank you for visiting SNEWPapers!
Sign up free
Alexandria Advertiser And Commercial Intelligencer
Alexandria, Virginia
What is this article about?
Analysis of 1790 and 1800 US censuses showing state population increases, rankings, and growth rates. Agricultural states outpaced commercial ones 3:1. Regrets lack of detailed societal data in census.
Merged-components note: Tables and accompanying text form a single article analyzing the 1800 census data; spatial overlap and sequential reading order confirm unity.
Clipping
OCR Quality
Full Text
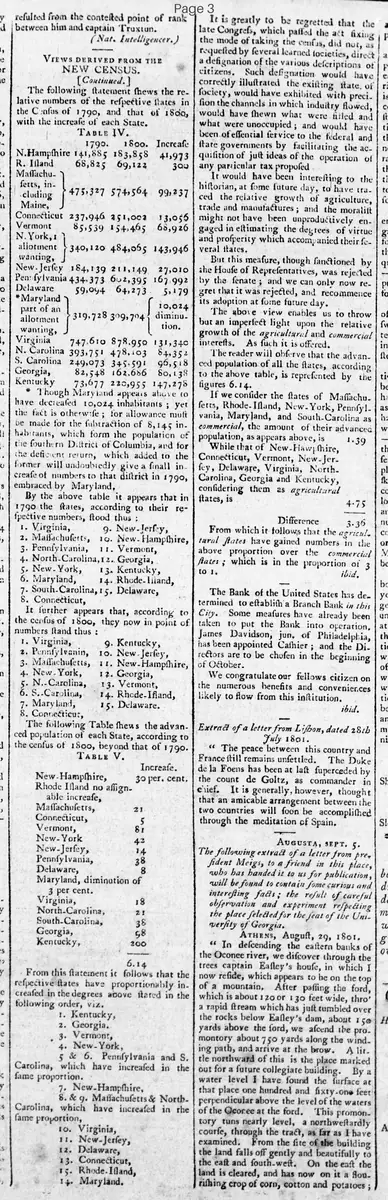
| 1790. | 1800. | Increase | |
| N. Hampshire | 141,885 | 183,858 | 41,973 |
| R. Island | 68,825 | 69,122 | 300 |
| Massachusetts, including | 475,327 | 574,564 | 99,237 |
| Maine, | |||
| Connecticut | 237,946 | 251,002 | 13,056 |
| Vermont | 85,539 | 154,465 | 68,926 |
| N. York, | |||
| allotment | 340,120 | 484,065 | 143,946 |
| wanting, | |||
| New Jersey | 184,139 | 211,149 | 27,010 |
| Pennsylvania | 434,373 | 602,395 | 167,992 |
| Delaware | 59,094 | 64,273 | 5,179 |
| Maryland | |||
| part of an | 10,024 | ||
| allotment | 319,728 | 309,704 | diminution. |
| wanting, | |||
| Virginia | 747,610 | 878,950 | 131,340 |
| N. Carolina | 393,751 | 478,103 | 84,352 |
| S. Carolina | 249,073 | 345,591 | 96,518 |
| Georgia, | 82,548 | 162,686 | 80,138 |
| Kentucky | 73,677 | 220,955 | 147,278 |
VIEWS Derived From The
NEW CENSUS.
[Continued.]
The following statement shows the relative numbers of the respective states in the Census of 1790, and that of 1800, with the increase of each State.
TABLE IV
Though Maryland appears above to have decreased 10,024 inhabitants; yet the fact is otherwise; for allowance must be made for the subtraction of 8,145 inhabitants, which form the population of the southern District of Columbia, and for the deficient return, which added to the former will undoubtedly give a small increase of numbers to that district in 1790, embraced by Maryland.
By the above table it appears that in 1790 the states, according to their respective numbers, stood thus:
1. Virginia,
9. New-Jersey,
2. Massachusetts,
10. New-Hampshire,
3. Pennsylvania,
11. Vermont,
4. North-Carolina, 12. Georgia,
5. New-York,
13. Kentucky,
6. Maryland,
14. Rhode-Island,
7. South-Carolina, 15. Delaware,
8. Connecticut,
It further appears that, according to the census of 1800, they now in point of numbers stand thus:
1. Virginia,
9. Kentucky,
2. Pennsylvania,
10. New-Jersey,
3. Massachusetts,
11. New-Hampshire,
4. New-York,
12. Georgia,
5. N. Carolina,
13. Vermont,
6. S. Carolina,
14. Rhode-Island,
7. Maryland,
15. Delaware.
8. Connecticut,
The following Table shows the advanced population of each State, according to the census of 1800, beyond that of 1790.
Table V.
6.14
From this statement it follows that the respective states have proportionably increased in the degrees above stated in the following order, viz.
1. Kentucky,
2. Georgia.
3. Vermont,
4. New-York,
5 & 6. Pennsylvania and S. Carolina, which have increased in the same proportion.
7. New-Hampshire,
8. & 9. Massachusetts & North. Carolina, which have increased in the same proportion,
10. Virginia,
11. New-Jersey,
12. Delaware,
13. Connecticut,
15. Rhode-Island,
14. Maryland.
| New-Hampshire, Rhode Island no assignable increase, Massachusetts, Connecticut, Vermont, New-York, New-Jersey, Pennsylvania, Delaware, Maryland, diminution of 3 per cent. Virginia, North-Carolina, South-Carolina, Georgia, Kentucky, | 30 per cent. 21 5 8 1 4 3 8 8 18 21 38 58 200 |
It is greatly to be regretted that the late Congress, which passed the act fixing the mode of taking the census, did not, as requested by several learned societies, direct a designation of the various descriptions of citizens. Such designation would have correctly illustrated the existing state of society, would have exhibited with precision the channels in which industry flowed, would have shown what were filled and what were unoccupied; and would have been essential service to the federal and state governments by facilitating the acquisition of just ideas of the operation of any particular tax proposed.
It would have been interesting to the historian, at some future day, to have traced the relative growth of agriculture, trade and manufactures; and the moralist might not have been unproductively engaged in estimating the degrees of virtue and prosperity which accompanied their several states.
But this measure, though sanctioned by the House of Representatives, was rejected by the senate; and we can only now regret that it was rejected, and recommend its adoption at some future day.
The above view enables us to throw but an imperfect light upon the relative growth of the agricultural and commercial interests. As such it is offered.
The reader will observe that the advanced population of all the states, according to the above table, is represented by the figures 6.14.
If we consider the states of Massachusetts, Rhode-Island, New-York, Pennsylvania, Maryland, and South-Carolina as commercial, the amount of their advanced population, as appears above, is 1.39
While that of New-Hampshire, Connecticut, Vermont, New-Jersey, Delaware, Virginia, North-Carolina, Georgia and Kentucky, considering them as agricultural states, is 4.75
Difference 3.36
From which it follows that the agricultural states have gained numbers in the above proportion over the commercial states; which is in the proportion of 3 to 1.
ibid.
What sub-type of article is it?
What keywords are associated?
Domestic News Details
Event Details
The article provides tables and analysis comparing population numbers of US states in the 1790 and 1800 censuses, including increases, rankings by population size, and proportional growth rates. It notes adjustments for Maryland and discusses the regrettable lack of detailed citizen classifications in the census. It concludes that agricultural states have grown faster than commercial ones in a 3:1 proportion.