Thank you for visiting SNEWPapers!
Sign up free
Sunbury American And Shamokin Journal
Sunbury, Northumberland County, Pennsylvania
What is this article about?
Comparison of Whig and Democratic popular vote majorities in elections across Kentucky, Indiana, North Carolina, Illinois, Missouri, and Alabama for 1836, 1840, and 1844, highlighting Democratic gains.
Merged-components note: The text and tables together form a cohesive report on late elections and popular vote, with spatial overlaps.
Clipping
OCR Quality
Full Text
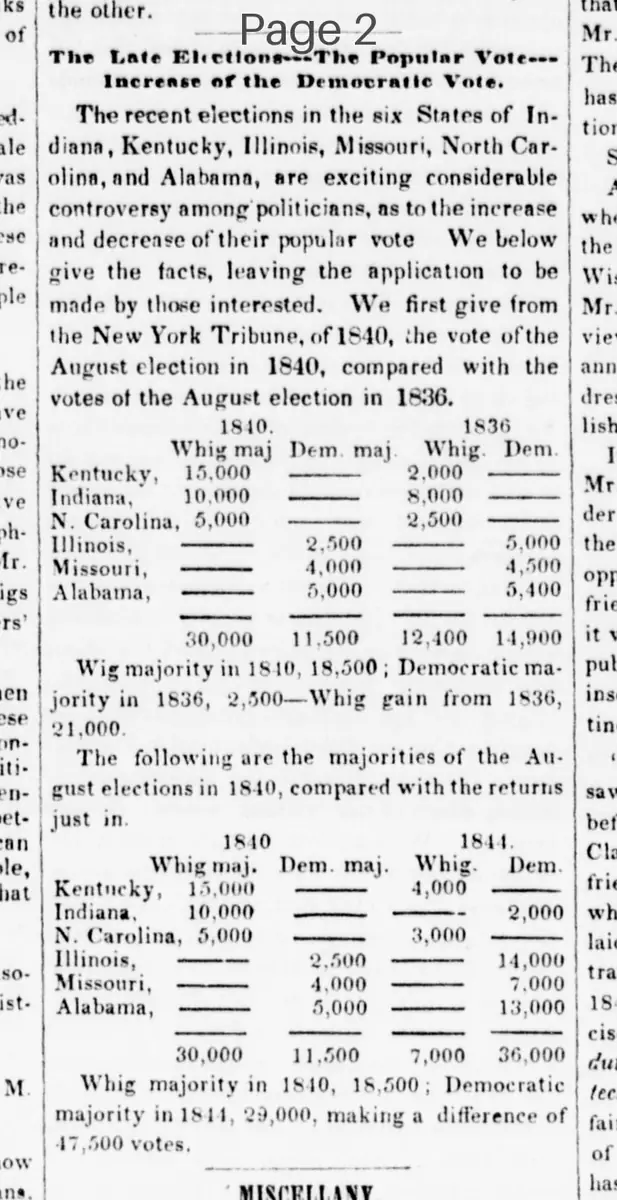
| 1840. | 1836 | ||
| Whig maj | Dem. maj. | Whig. | Dem. |
| Kentucky, | 15,000 | 2,000 | — |
| Indiana, | 10,000 | 8,000 | — |
| N. Carolina, | 5,000 | 2,500 | — |
| Illinois, | — | 2,500 | 5,000 |
| Missouri, | — | 4,000 | 4,500 |
| Alabama, | — | 5,000 | 5,400 |
The Late Elections. The Popular Vote. Increase of the Democratic Vote.
The recent elections in the six States of Indiana, Kentucky, Illinois, Missouri, North Carolina, and Alabama, are exciting considerable controversy among politicians, as to the increase and decrease of their popular vote
We give the facts, leaving the application to be made by those interested. We first give from the New York Tribune, of 1840, the vote of the August election in 1840, compared with the votes of the August election in 1836.
Whig majority in 1840, 18,500; Democratic majority in 1836, 2,500-Whig gain from 1836, 21,000.
The following are the majorities of the August elections in 1840, compared with the returns just in.
Whig majority in 1840, 18,500; Democratic majority in 1844, 29,000, making a difference of 47,500 votes.
| Whig maj. | Dem. maj. | Whig. | Dem. | |
| Kentucky, | 15,000 | — | 4,000 | — |
| Indiana, | 10,000 | — | — | 2,000 |
| N. Carolina, | 5,000 | — | 3,000 | — |
| Illinois, | — | 2,500 | — | 14,000 |
| Missouri, | — | 4,000 | — | 7,000 |
| Alabama, | — | 5,000 | — | 13,000 |
What sub-type of article is it?
What keywords are associated?
Where did it happen?
Domestic News Details
Primary Location
Kentucky, Indiana, North Carolina, Illinois, Missouri, Alabama
Event Date
August Elections 1836, 1840, 1844
Outcome
whig majority in 1840: 18,500; democratic majority in 1836: 2,500 (whig gain 21,000); democratic majority in 1844: 29,000 (difference of 47,500 votes)
Event Details
Recent elections in six states excite controversy over popular vote changes. Tables compare Whig and Democratic majorities from 1840 vs. 1836 and 1840 vs. 1844, showing Democratic increases.